Introduction
It’s entirely possible to retrieve bulk Australian Stock Exchange (ASX) data directly into R. This not only allows easy statistical analysis, but it empowers one to build data pipelines that employ advanced data transformations and machine learning. I couldn’t find any information or sample code myself so I pieced it together myself, it is straightforward to get data for one company, but less so for many. I decided to write this guide so others don’t have to repeat what I already did. I’ll leave the analysis of ASX data to others, or perhaps a later post.
We’ll be using the excellent quantmod package and yahoo finance service. It should be noted that I used the following code in functions, which I am not doing here for clarity, however they can be easily be converted if you want to build something more extravagant.
The actual data available is limited to the daily aggregates:
- yahoo company ticker code
- open price
- highest price
- lowest price
- close price
- volume traded
- adjusted
- date
Let’s begin
Getting a list of valid stocks
There is a file hosted on the ASX website that contains all companies listed on the Australian stock exchange. We could manually download it and import it into our R environment, or we could simply import it directly into R, since the read.csv also reads URLs.
Notice in the code block below, we append .AX to the ASX code, this is the “ticker” format that Yahoo finance uses.
library(quantmod)
library(dplyr)
valid_stocks <- read.csv("http://www.asx.com.au/asx/research/ASXListedCompanies.csv",skip=1) %>%
  select(ASX.code) %>%
mutate(ASX.code = paste0(ASX.code,".AX")) |
This file is great, but it includes hundreds of companies that are no longer trading. Let’s remove these by checking with Yahoo finance which asx listed companies are actively trading. We use the quantmod library which contains a function called getSymbols. This handy little function retrieves data for a single stock in a date range. Note that we wish to retrieve data for all the stocks, so we’ll use a loop. Other things to notice about this code block include:
- Before looping, we define an empty vector c_valid_stocks, we’ll iteratively populate this vector with the loop.
- The tryCatch function prevents the loop from breaking when there is an invalid stock.
library(dplyr)

c_valid_stocks <- c()
for (ax_ticker in valid_stocks[,1]) {
  tryCatch({
    df_stock <- data.frame(ax_ticker=ax_ticker,
                                     getSymbols(ax_ticker,
                                                src = 'yahoo',
                                                from=Sys.Date(),
                                                auto.assign = FALSE)
                                               )
    c_valid_stocks <- c(c_valid_stocks,df_stock)
  },
 error=function(e){})
} |
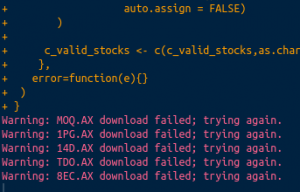
This loop takes some time to run, but it only needs to be used infrequently. ASX listed companies don’t frequently de-list. The companies that are no longer valid will appear in the console warnings:

Retrieving bulk ASX data
To retrieve the actual data, we’ll be using an extension of the code we have just used above. So if you are comfortable with that, you won’t have a problem. Some things to notice in the code are:
- We define the date range of the date with arguments from and to in the getSymbols functions. These can obviously be altered to whatever you need.
- We need to rename the returned data. The getSymbols function is designed to return data on one stock at a time, and it includes the stock name in the column names of the returned data, making it difficult to rbind.
df_all_stocks <- data.frame()
for (ax_ticker in c_valid_stocks$ASX.code) {
 tryCatch({
   df_get <- data.frame(getSymbols(
     ax_ticker
     ,src = 'yahoo'
     ,from=Sys.Date()-years(1) # feel free to change this date range
     ,to=Sys.Date()       # this one too
     ,auto.assign = FALSE))

   df_get$Date <- row.names(df_get)
   row.names(df_get) <- NULL
   df_stock <- data.frame(ax_ticker=ax_ticker,df_get)
   names(df_stock) <- c("ax_ticker","OPEN","HIGH","LOW","CLOSE","VOLUME","ADJUSTED","Date")
   df_all_stocks <- rbind(df_all_stocks,df_stock)
 },
 error=function(e){})
} |
This code can take some time to run, but it’s worth it. Here is a sample of the results:
head(df_all_stocks) |
| ax_ticker | OPEN | HIGH | LOW | CLOSE | VOLUME | ADJUSTED | Date |
|---|---|---|---|---|---|---|---|
| ONT.AX | 6.6 | 6.69 | 6.6 | 6.69 | 188 | 6.449265 | 2017-07-03 |
| ONT.AX | 6.69 | 6.69 | 6.69 | 6.69 | 0 | 6.449265 | 2017-07-04 |
| ONT.AX | 6.72 | 6.85 | 6.72 | 6.82 | 2142 | 6.574587 | 2017-07-05 |
| ONT.AX | 6.9 | 7 | 6.9 | 6.96 | 7212 | 6.709549 | 2017-07-06 |
| ONT.AX | 7 | 7 | 6.9 | 7 | 13109 | 6.74811 | 2017-07-07 |
| ONT.AX | 7.05 | 7.07 | 7.05 | 7.07 | 2390 | 6.815591 | 2017-07-10 |
That’s it, I hope this has helped someone to begin analysing ASX data in R, let me know in the comments.